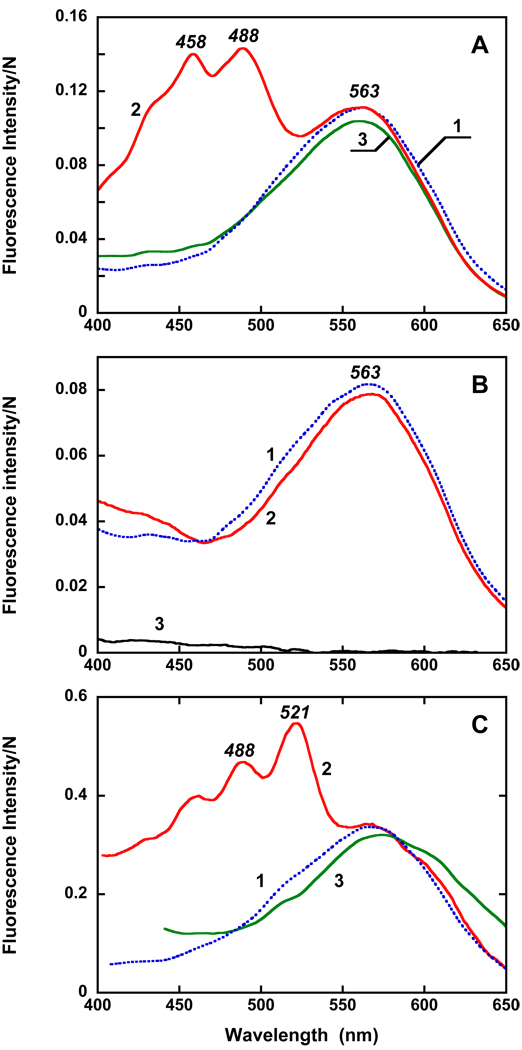
Figure 6.
Excitation spectra for fluorescence emission of the retinal chromophore at 720 nm for: A. 1, gloeobacter rhodopsin; 2, as 1 but reconstituted with echinenone; 3, as 1 but with β-carotene added. Carotenoid/retinal ratio was 1:1; concentration of rhodopsin, close to 4 µM. pH 4.2 Absorbance of the samples in the maximum are between 0.1 and 0.2. B. 1, the G178W mutant, pH 4.2; 2, after reconstitution with echinenone (28 hours after addition). 3, Echinenone in 0.02% DDM (same concentration as in 2). C. 1, gloeobacter rhodopsin; 2, after reconstitution of gloeobacter rhodopsin with salinixanthin; 3, after mixing of gloeobacter rhodopsin with salinixanthol. Bandwidth of excitation beam, 8 nm.

