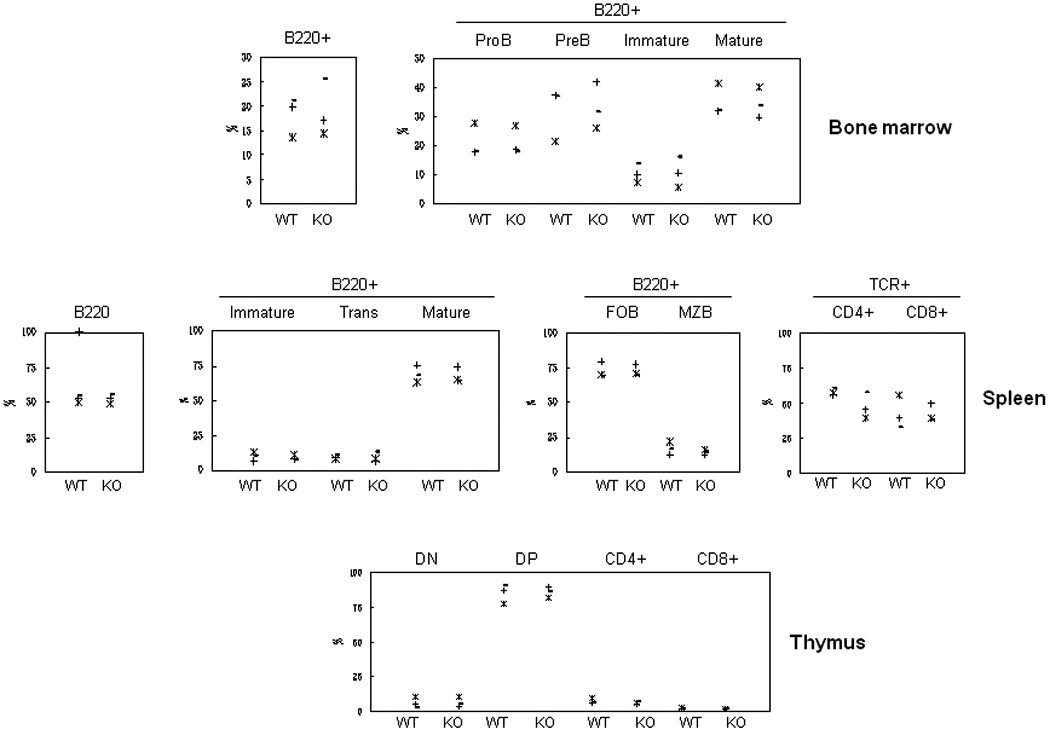
Fig. 2. Analysis of lymphocyte subpopulations by flow cytometry.

The frequency of the various lymphoid subpopulations was analyzed by flow cytometry using the markers described in the Materials and Methods. B cell populations analyzed were: Bone marrow, total B220+, proB, preB, immature and mature B; Spleen, total B220+, immature, transitional (Trans) and mature B, follicular B (FOB) and marginal zone B (MZB). T cell populations analyzed were: Spleen, CD4+ and CD8+; thymus, CD4 and CD8 double negative (DN) and double positive (DP), CD4+ and CD8+ single positive. Each symbol represents one mouse. Three pairs of mice were analyzed in these experiments. Representative flow cytometry profiles are shown in Fig. S3.
