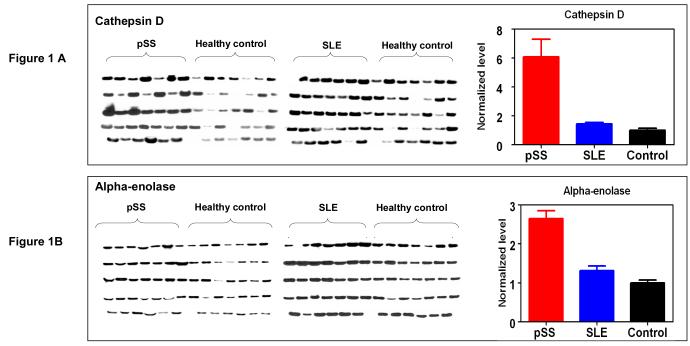
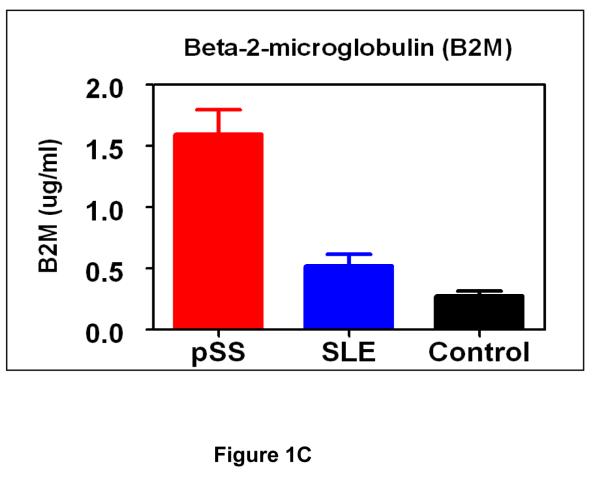
Figure 1.
Validation of protein biomarkers, cathepsin D (A), alpha-enolase (B) and B2M (C), in independent patient (pSS) and control (SLE and healthy control) populations (n=34 for each group). B2M was validated by ELISA and mean±SEM is plotted. Cathepsin D and alpha-enolase were validated by western blotting, and the bar figures indicate the normalized levels of cathepsin D and alpha-enolase among three groups (mean±SEM).


