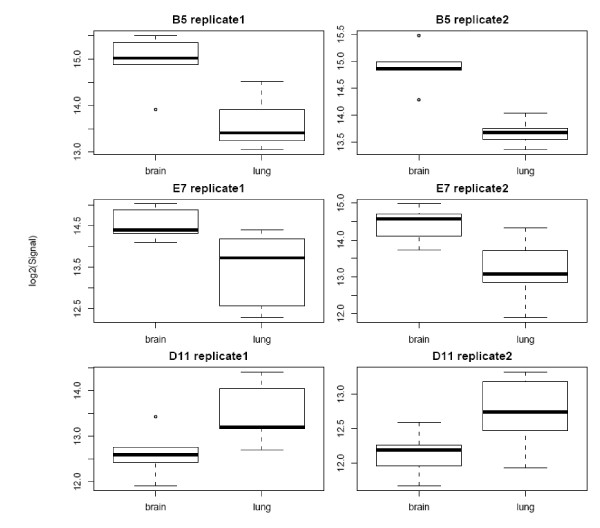
Figure 2.
Replicate measurements of the top three differentially reactive clones. Performance of the top three differentially reactive clones (B5, E7 and D11 with p-values less than 0.002, 0.01, 0.05, respectively) in replicate experiments. The normalized signal intensity values of these reactive clones across the replicate measurements (replicate-1 and -2) distinguishes between brain (n = 5) and lung (n = 5) cancer serum samples.

