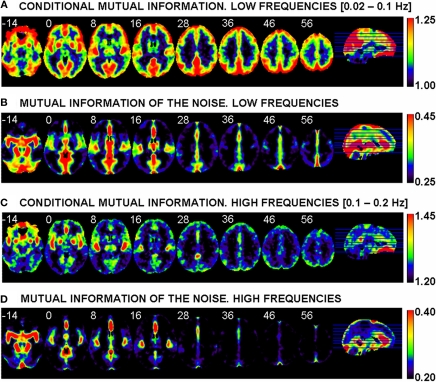
Figure 3.
Averages, over the sample of 45 healthy controls, of the conditional mutual information (MI) for the low frequencies (A) and the high frequencies (C). Averages of the MI of the noise (MI with the five points of high variance shown in Figure 2) for the low (B) and high (D) frequencies. Left side of image is left side of brain. White numbers give the z MNI coordinate of each slice shown.

