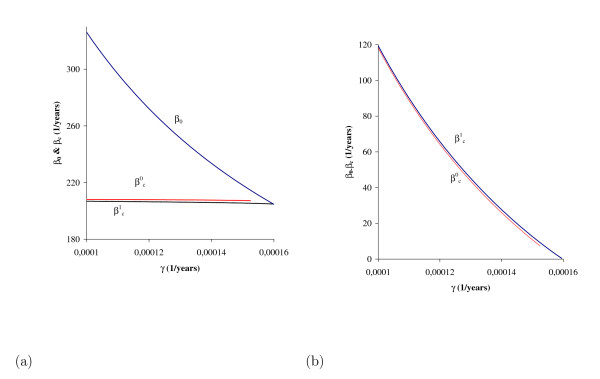
Figure 7.
The threshold (β0) and lower bound (, for q = 0 and 1) transmission coefficients as a function of the incubation rate γ, using p = 0.01; all other values are those given in Table 1. β0, and are decreasing functions, with . When q = 1, they assume the same value ( = 205 years-1) at γ = 0.0001595 years-1, and for q = 0, they assume the same value ( = 207 years-1) at γ = 0.000158 years-1 (a). At a given γ, the difference between β0 and (or , which is practically the same) corresponds to the range of β in which two positive solutions are found (b).

