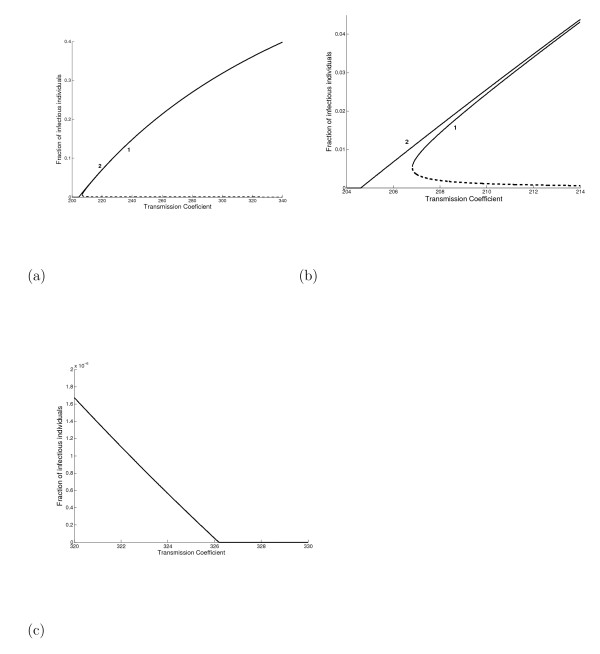
Figure 9.
The bifurcation diagram (a) in a strong immune response, that is, p = 0.01, for two values of γ (in years-1): 0.0001 (backward bifurcation, labelled 1) and 0.00016 (forward bifurcation, with β0 = 204.626 , labelled 2). We give, in (b) and (c) respectively, a zoom near the lower bound () and threshold (β0 = 326.19 years-1) transmission coefficients with respect to the backward bifurcation.

