Figure 5.
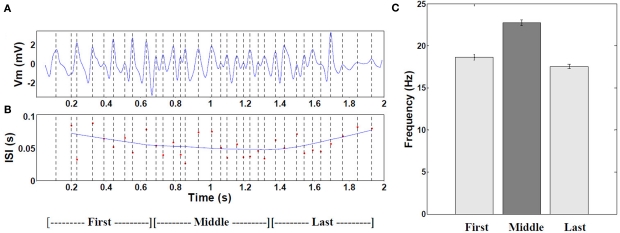
Frequency of intracellular theta. (A) Example of 6–10 Hz filtered mean theta within a typical place field. (B) Corresponding moving window-average of the theta oscillation period. (n = 19 cells with increasing mean). (C) Comparison of the mean frequency during the first, middle, and last thirds of all fields (P < 0.001 by ANOVA, middle versus combined first and last thirds, n = 472 cells with increasing mean). Error bars are ±1 S.E.M. The increased frequency results from interference of signal arriving from the apical dendrites (mixture of visual pathway and local OLM inhibitory theta) and the local BC theta effect (180° out of phase with OLM, as experimental shown by Kamondi et al. (1998).

