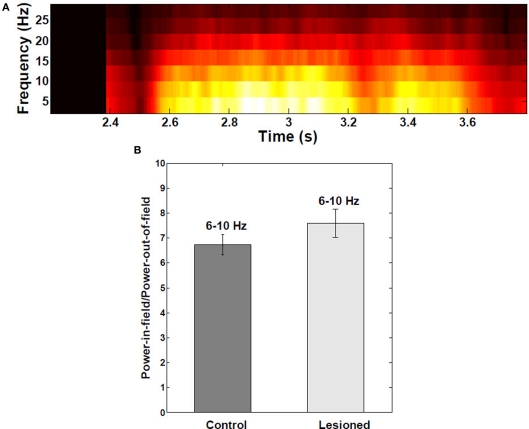
Figure 6.
Spectral analysis of intracellular membrane potential recordings. (A) Power spectral analysis as a function of the mouse's position on the linear track (n = 30 fields). Theta-band (6–10 Hz) power in the membrane potential trace was greater and redistributed to upper theta range toward middle of place fields, due interference of local inhibitory theta with visually-driven apical dendritic input. (B) Ratio of theta power inside:outside the place field to power did not change significantly when EC was lesioned (n = 390 cells from both control and lesioned groups). Error bars are ±1 S.E.M.

