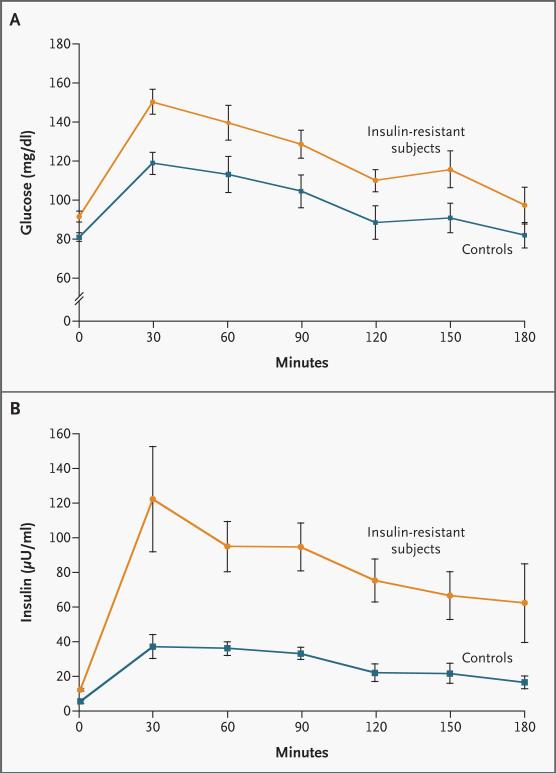
Figure 1. Mean (±SE) Plasma Concentrations of Glucose (Panel A) and Insulin (Panel B) before and during an Oral Glucose-Tolerance Test in 9 Insulin-Sensitive Controls and 14 Insulin-Resistant Subjects.
P=0.016 for the comparison of the areas under the curve for glucose concentration of control subjects and insulin-resistant subjects, and P=0.002 for the comparison of the areas under the curve for insulin concentration of control subjects and insulin-resistant subjects. To convert values for glucose to millimoles per liter, multiply by 0.05551. To convert values for insulin to picomoles per liter, multiply by 6.0.

