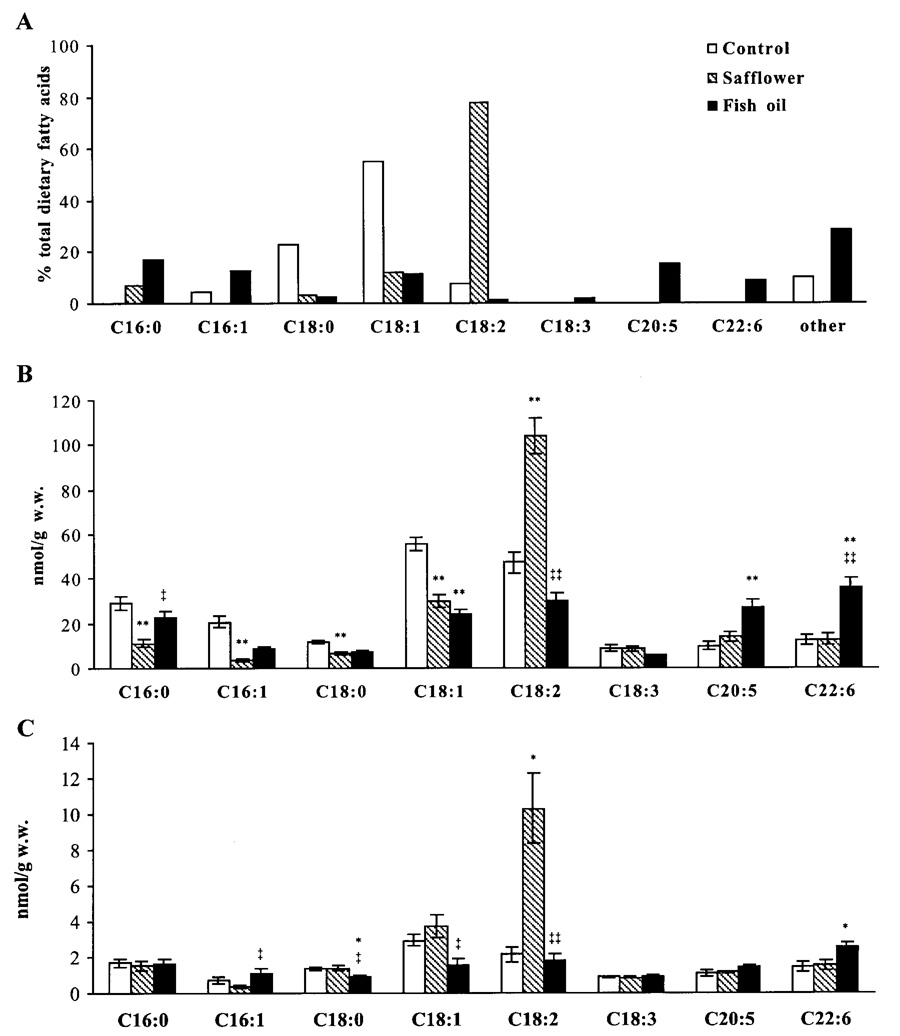
Fig. 1.
Fatty acid profile (A) of soybean oil (control diet), safflower oil, and fish oil and long-chain or very long-chain fatty acyl-CoA species in liver (B) and skeletal muscle (C) from control, safflower oil-fed, and fish oil-fed rats. Approximately 200 mg of tissue were homogenized, and long-chain/very long-chain fatty acyl-CoAs were extracted. With use of a tandem mass spectrometer, fatty acyl-CoAs were ionized in negative electrospray mode. As an internal standard, C17 CoA ester was used. *P < 0.01, **P < 0.0001 vs. control; ‡P < 0.02, ‡‡P < 0.0001 vs. safflower.

