
FIG. 2.
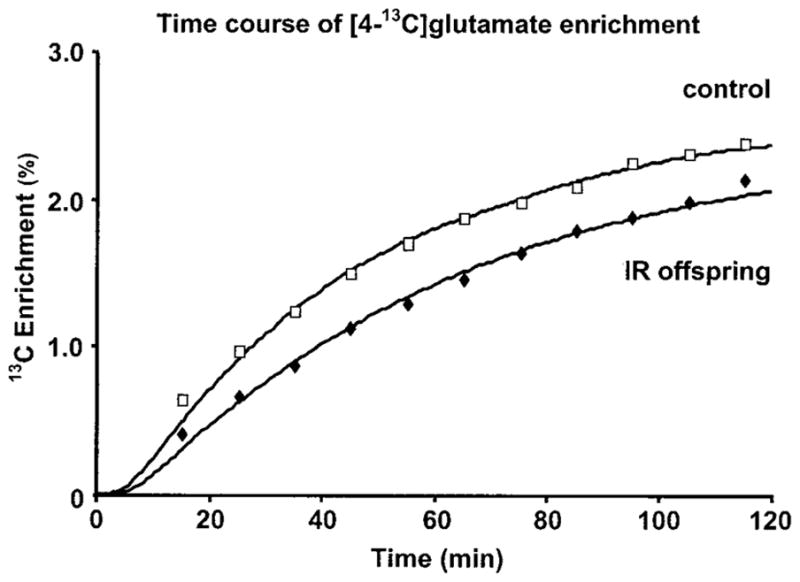
Time course of enrichment (averaged data) of the muscle [4-13C]glutamate pool, measured by 13C MRS, during an infusion of [2-13C]acetate in insulin-resistant offspring of type 2 diabetic patients (◆, n = 12) and insulin-sensitive control subjects (□, n = 7). The curves of incorporation for each individual were computer modeled using CWave software to generate an estimate of TCA cycle flux using a nonlinear least-squares fitting algorithm. A CWave fit of the averaged data for each group is shown and yielded identical TCA cycle fluxes as the data for each individual.