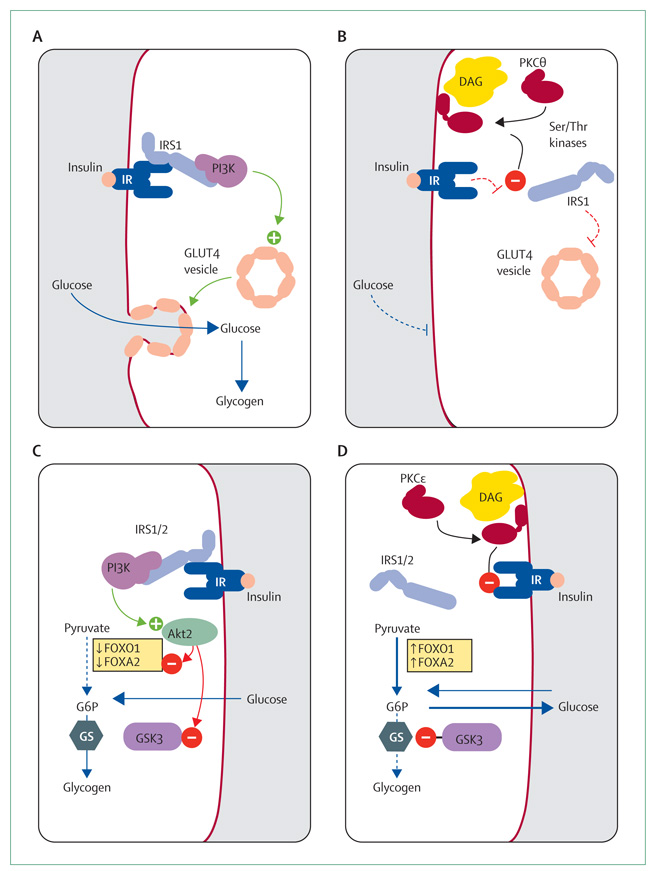
Figure 2. Mechanisms of insulin sensitivity and resistance in muscle and liver.
(A) Insulin-sensitive muscle. (B) Insulin-resistant muscle. (C) Insulin-sensitive liver. (D) Insulin-resistant liver. IRS=insulin-receptor substrate. IR=insulin receptor. PI3K=1-phosphatidylinositol 3-kinase. GLUT4=glucose transporter 4. DAG=diacylglycerol. PKC=protein kinase C. Ser=serine. Thr=threonine. FOX01=forkhead box O1. FOXA2=forkhead box A2. G6P=glucose-6-phosphate. GS=glycogen synthase. GSK=glycogen synthase kinase. Green circle with plus sign represents activation. Red circle with minus sign represents inactivation. Solid line with arrowhead represents increase or accumulation of substrate. Dotted line indicates inhibition of pathway.

