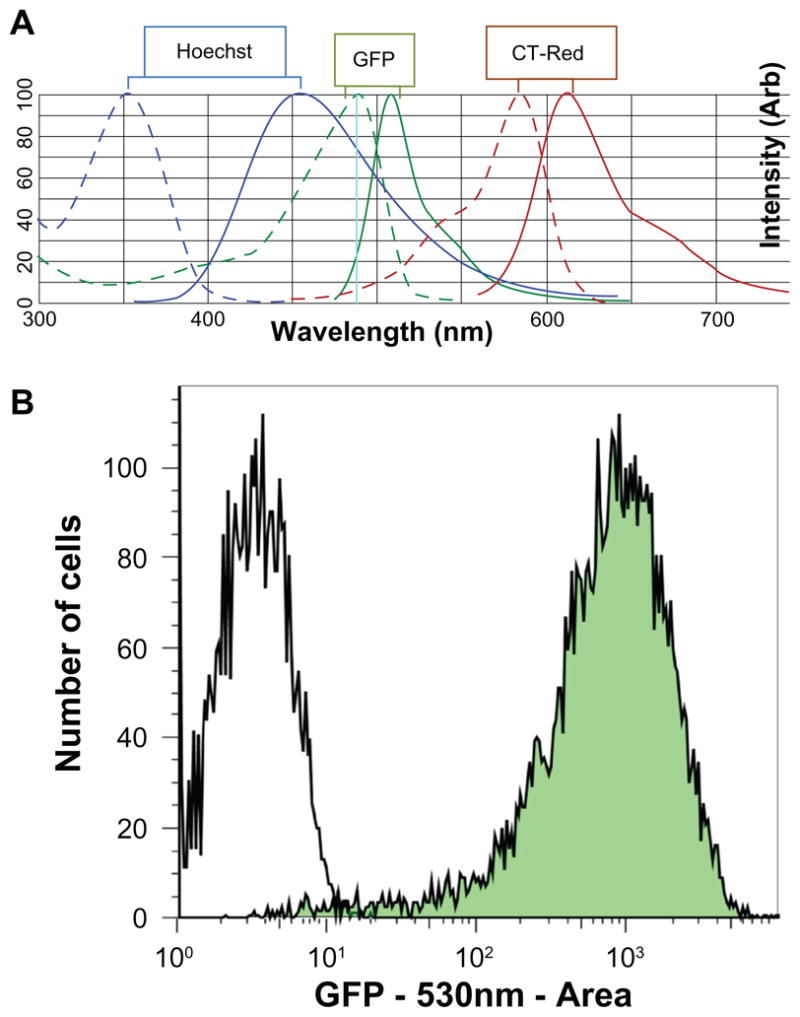
Figure 2.

A) Spectral multiplexing of Hoechst (blue), GFP, and CellTracker-Red fluorescent probes. B) Flow cytometry analysis of a stable EPTFR-HepG2 line (green) and a wild-type HepG2 line showing suitability of the cell line for high-content screening purposes. The filled histogram shows a monophasic population of cells with substantial GFP expression (approximately 300× greater than the negative population). This cell population is sampled from the low-passage master cell-bank that was used in this screening effort.
