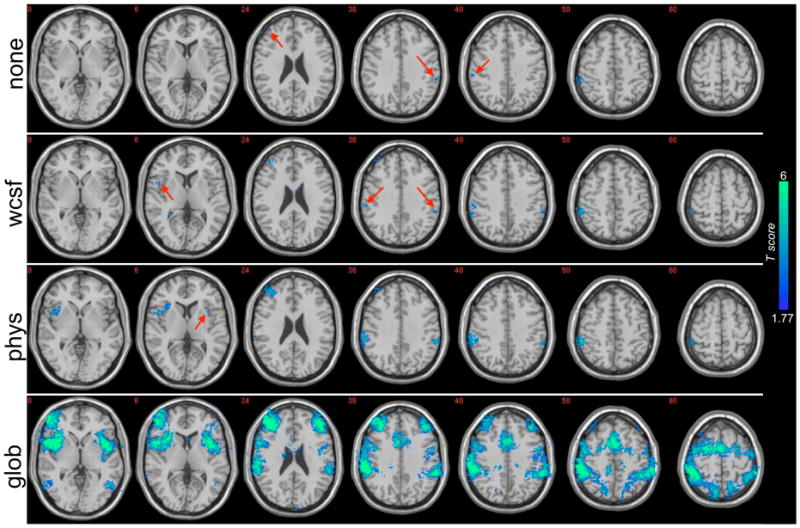
Figure 4.

Regions having negative correlation (p<0.05 uncorrected) with the precuneus/PCC in a group-level (N=15), random-effects analysis. Results are shown before corrections were applied (“none”), after white/CSF signal removal (“wcsf”), after physiological noise correction (“phys”), and after global signal removal (“glob”). Locations of small clusters are indicated with red arrows. Intensity values represent T-statistics.
