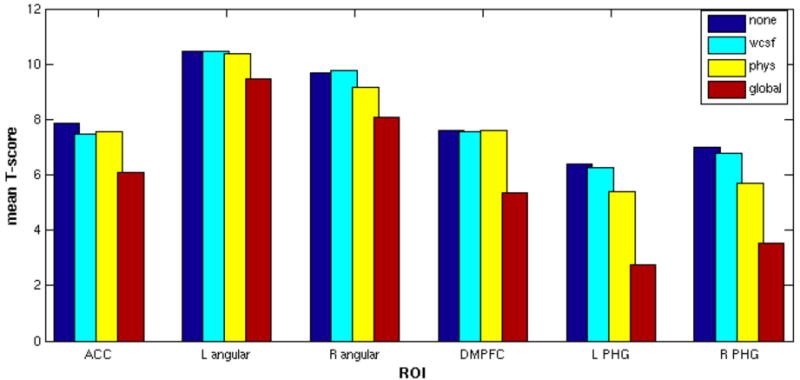
Figure 6.

ROI analysis of DMN group-level statistics. For each of the 4 statistical maps of the DMN (shown in Figure 5), average T-scores were computed across voxels within 6 core regions of the DMN. ACC, anterior cingulate cortex; DMPFC, dorso-medial prefrontal cortex; PHG, parahippocampal gyrus.
