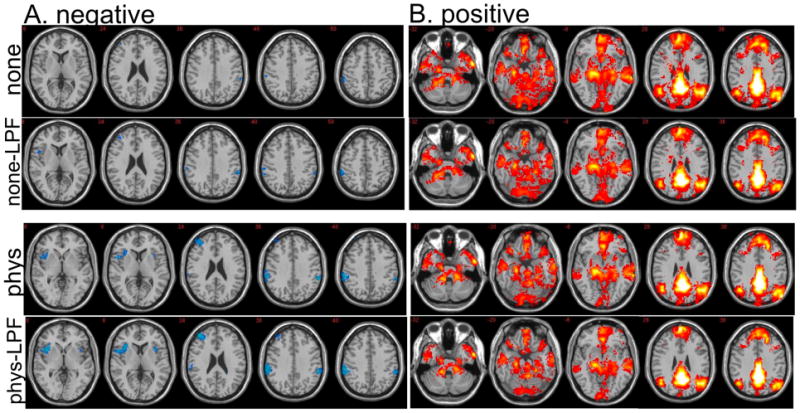
Figure 7.

Effect of temporal low-pass filtering on a group-level, random-effects analysis of (A) negative and (B) positive correlations with the PCC. Maps are thresholded identically to Figs. 4 and 5: negative correlations are shown at 1.77<T<6, and positive correlations are shown at 4<T<15. Slices shown are a subset of those in Figs. 4 and 5. (“none” = uncorrected data; “none-LPF” = uncorrected data after low-pass filtering; “phys” = physiological noise-corrected data; “phys-LPF” = physiological noise-corrected data after low-pass filtering.)
