Figure 1.
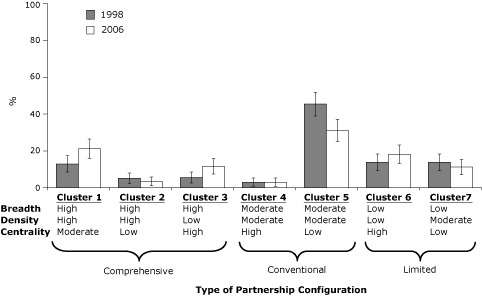
Prevalence of 7 public health partnership configurations, 1998 and 2006. Error bars represent 95% confidence intervals. Data were obtained from a survey of the 351 agencies that responded in both years (29,30). Seven configurations were identified through multivariate cluster analysis, each one distinguished by network breadth, density, and centrality. Breadth represents the array of actors involved in the partnerships; density represents the amount of interconnectedness between organizations; and centrality represents the relative influence of a single organization within a partnership.
| Type of Partnership Configuration (Breadth/Density/Centrality) | Prevalence, % (95% CI) | |
|---|---|---|
|
| ||
| 1998 | 2006 | |
| Comprehensive | ||
| Cluster 1 (High/High/Moderate) | 13 (9-17) | 21 (16-27) |
| Cluster 2 (High/High/Low) | 5 (2-8) | 3 (1-6) |
| Cluster 3 (High/Low/High) | 6 (3-9) | 12 (8-16) |
| Conventional | ||
| Cluster 4 (Moderate/Moderate/High) | 3 (1-5) | 3 (1-5) |
| Cluster 5 (Moderate/Moderate/Low) | 45 (39-52) | 31 (25-37) |
| Limited | ||
| Cluster 6 (Low/Low/High) | 14 (9-18) | 18 (13-23) |
| Cluster 7 (Low/Moderate/Low) | 14 (9-18) | 11 (7-15) |