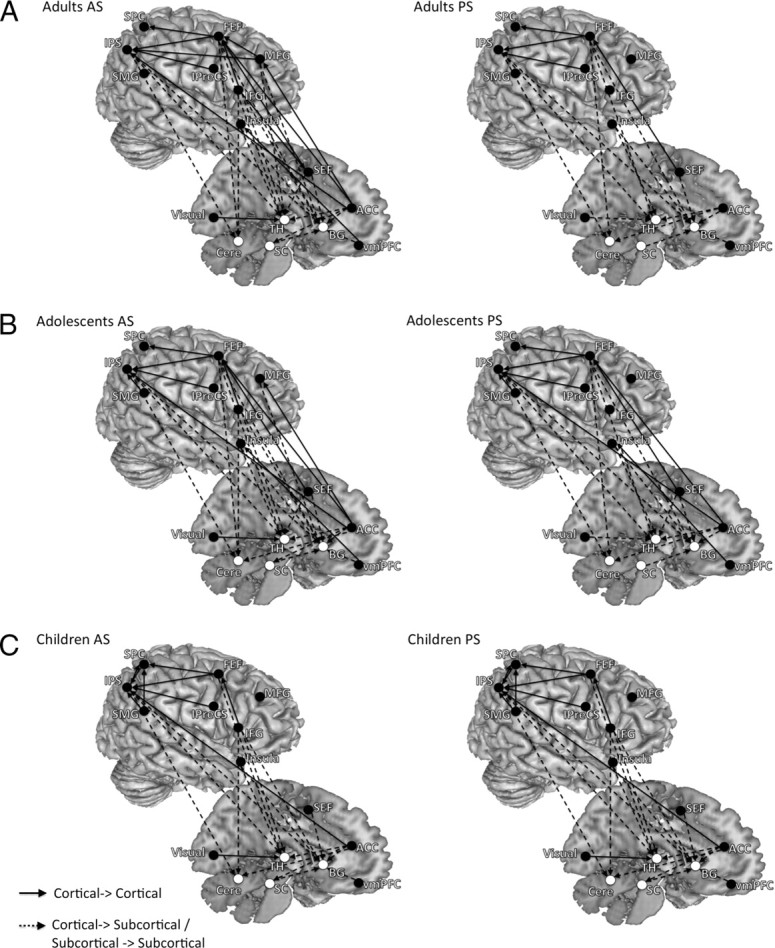
Figure 2.

The results of effective connectivity analysis for both the AS and PS tasks, separated by age group and task (A, adults; B, adolescents; C, children). Both left- and right-hemisphere connections are placed on the right hemisphere to aid with visualization. Arrows connecting two ROIs represent significant effective connectivity from one ROI to another. Only significant connections (FDR < 0.05) are displayed. For the AS task, across age groups we observed dominant influencing connectivity from frontal regions to parietal regions and subcortical regions. Connections were also evident from parietal regions to subcortical regions. The PS connectivity profile lacked connections seen in AS from the right frontal cortex to parietal and subcortical regions.
