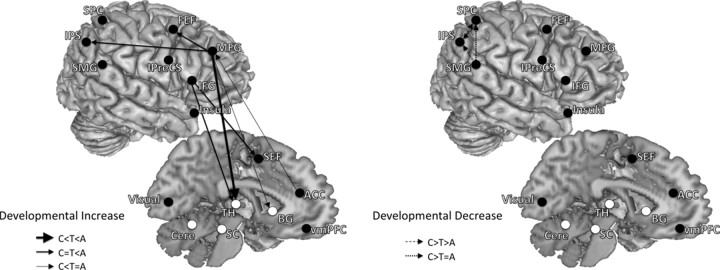
Figure 4.
Developmental patterns of effective connectivity underlying inhibitory control. These are connections in which effective connectivity strengths were significantly different across age groups (children, adolescents, adults). Both left- and right-hemisphere connections are placed on the right hemisphere to aid with visualization. Connections are grouped into two overarching developmental patterns: developmental increase and developmental decrease. Left shows connections that showed developmental increase in effective connectivity strengths (adults significantly greater than adolescents and/or adolescents significantly greater than children). Right shows connections that showed developmental decrease in effective connectivity strengths (children significantly greater than adolescents and/or adolescents significantly greater than adults). Solid lines with arrows represent developmental increasing connections, and dashed lines with arrows represent developmental decreasing connections. Connections from frontal to parietal and subcortical regions increased with age, whereas connections within the parietal cortex decreased with age. A, Adults; C, children; T, adolescents.

