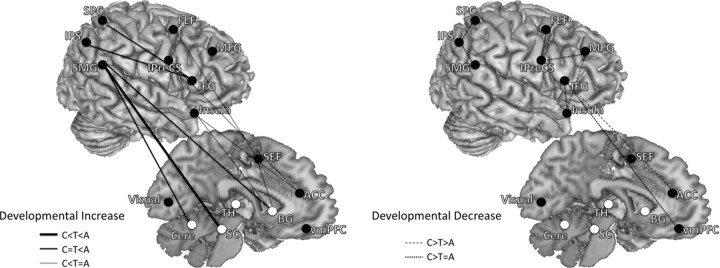
Figure 6.
Developmental patterns of functional connectivity associated with the AS task. Connections are grouped into two overarching developmental patterns: developmental increase and developmental decrease. Both left- and right-hemisphere connections are placed on the right hemisphere to aid with visualization. Left shows connections that showed developmental increases in functional connectivity (adults significantly greater than adolescents and/or adolescents significantly greater than children). Right shows connections that showed developmental decreases in functional connectivity (children significantly greater than adolescents and/or adolescents significantly greater than adults). Solid lines represent developmental increasing connections, and dashed lines represent developmental decreasing connections. Functional connectivity between distant regions increased with age, whereas functional connectivity within the frontal and parietal cortex decreased with age. A, Adults; C, children; T, adolescents.

