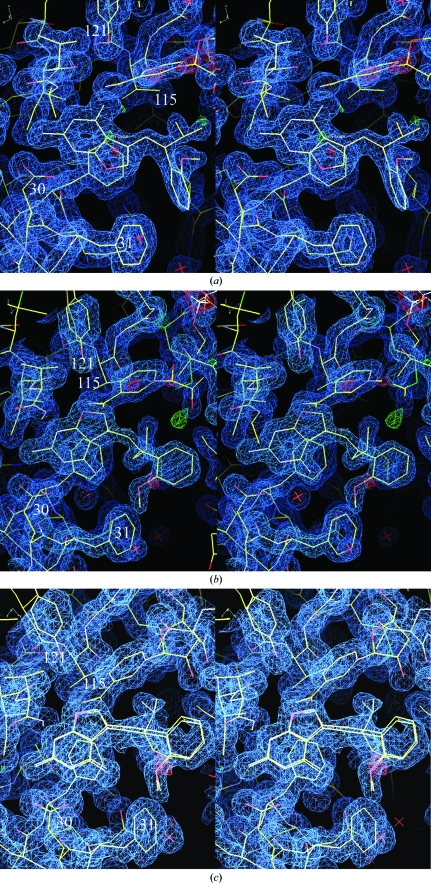
Figure 2.
(a) View of the 2F o − F c difference electron-density map for hDHFR–NADPH–Z3 contoured at 1.1σ (blue). The red crosses represent water molecules. These data clearly show a ternary complex with the inhibitor Z3 binding in the normal antifolate orientation with N1 and the 2-amino group interacting with Glu30. The configuration about the propenyl double bond is Z, with the 2′-methoxyphenyl ring cis to the furopyrimidine ring. (b). View of the 2F o − F c difference electron-density map for hDHFR–NADPH–E2 contoured at 1.4σ (blue). These data clearly show a ternary complex with the inhibitor E2 bound with a ‘flipped’ furopyrimidine orientation with the furo oxygen occupying the position of the 4-amino group of the antifolate. The configuration about the propenyl double bond is E, with the 2′-methoxyphenyl ring trans to the furopyrimidine ring. (c) View of the 2F o − F c difference electron-density map for hDHFR–NADPH–E6 contoured at 0.9σ (blue). These data clearly show a ternary complex with the inhibitor E6 bound with a ‘flipped’ furopyrimidine orientation with the furo oxygen occupying the position of the 4-amino group of the antifolate. Note the disorder in the C9-isobutyl side chain. The configuration about the propenyl double bond is E, with the 2′-methoxyphenyl ring trans to the furopyrimidine ring.

