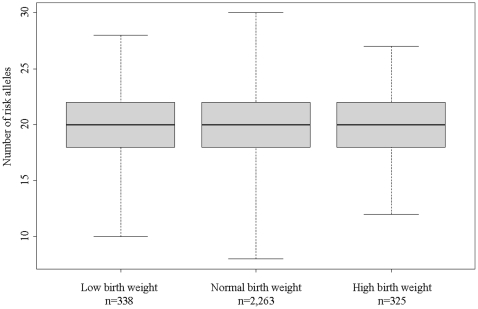
Figure 2. Boxplot showing the number of obesity risk alleles in individuals with low, normal and high birth weight, respectively (n = 2,926).
The black line is the median number of risk alleles, the grey boxes represent the interquartile range and the whiskers denote the range of risk alleles within each group. Individuals with low birth weight (n = 338) were born at or below the sex-specific 10th percentile of birth weight in the Inter99 population, while individuals with high birth weight (n = 325) were born at or above the sex-specific 90th percentile of birth weight.

