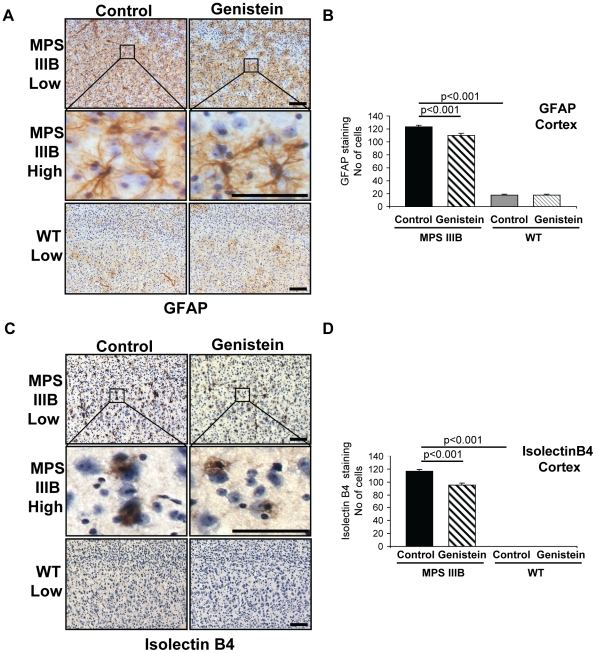
Figure 2. Neuroinflammatory markers are reduced in brains of MPSIIIB mice after genistein treatment.
(A) Representative Glial Fibrillary Associated Protein (GFAP) staining of astrocytes (brown) in the cerebral cortex of 11 month old MPSIIIB and WT mice with and without long-term genistein treatment. Sections have been counterstained with haematoxylin to highlight nuclei (blue). The images correspond to section 2 shown in Figure 1A. Boxed areas are enlarged to show individual astrocyte cell bodies. Bar = 100 µm for low power images and 50 µm for enlargements. (B) The mean number of GFAP positive cells in the cerebral cortex per low power field of view were counted as described in Figure 1. (C) Representative Isolectin B4 staining of microglial cells (brown) in the cerebral cortex. Sections have been counterstained with haematoxylin to highlight nuclei (blue). The images correspond to section 2 shown in Figure 1A. Boxed areas are enlarged to show individual microglial cells. Bar = 100 µm for low power images and 50 µm for enlargements. (D) The mean number of Isolectin B4 positive cells in the cerebral cortex per low power field of view were counted. For all graphs genders were pooled, thus n = 12 mice per group, error bars represent SEM, p values are for Tukey's multiple comparisons test.

