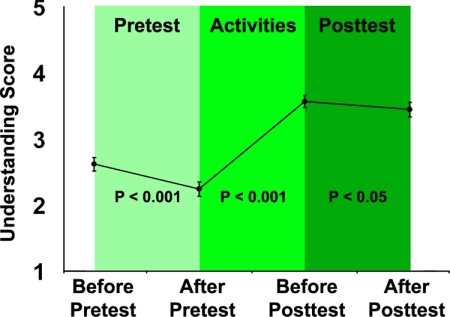
Figure 9.
Students' understanding scores (mean ± SEM) for each of the topics (7–8 per module) were averaged to give the student one understanding score at each of the four time points for that module. Individual students completed between one and four modules. If students completed more than one module, their understanding scores were averaged across modules. Thus, each student (N = 39) received a composite score at each time point. Statistically significant differences by paired t-test are indicated in the figure.

