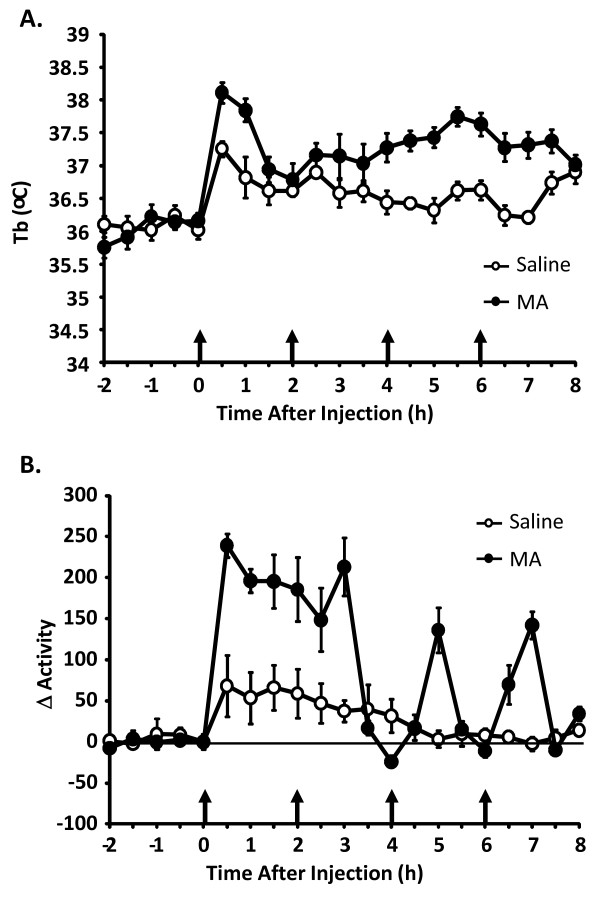
Figure 1.
Body temperature and locomotor activity during methamphetamine administration. Effect of 4 i.p. injections of MA on Tb (A), and change in locomotor activity (B) Open symbols represent saline controls and closed symbols represent MA administration (n = 16-18 per group). Activity data is presented as 30 minute averages from time of injection. Arrows indicate injection times.

