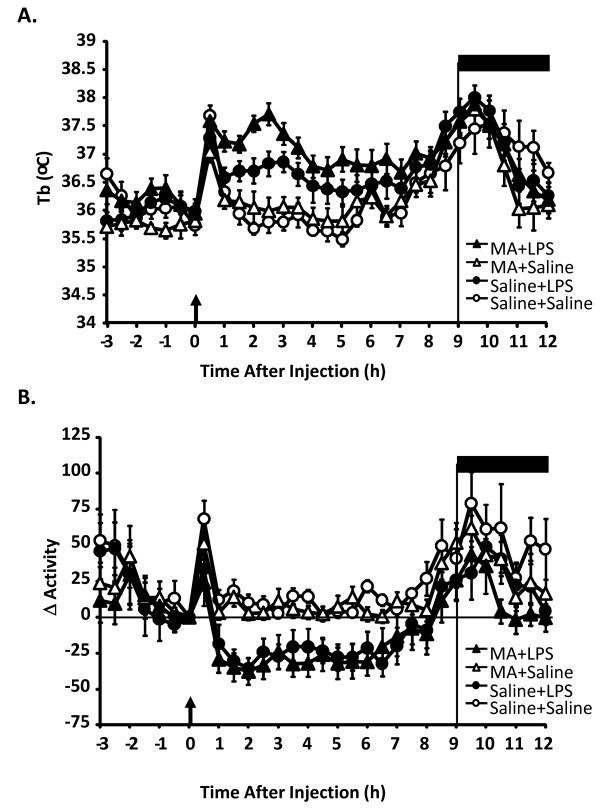
Figure 2.
Body temperature and locomotor response to LPS in mice exposed to methamphetamine. Tb (A) and locomotor activity (B) after LPS or saline in mice exposed to MA. Mice were exposed to 4 i.p. injections of 0 or 5 mg/kg MA and then injected with 100 μg/kg LPS or saline, 24 h after the first MA injection. Open circles represent saline + saline administration, open triangles represent saline + MA administration, closed circles represent saline + LPS administration and closed triangles represent mice MA + LPS administration (n = 6-10 per group). Arrow indicates time of injection; dark bar indicates lights off.

