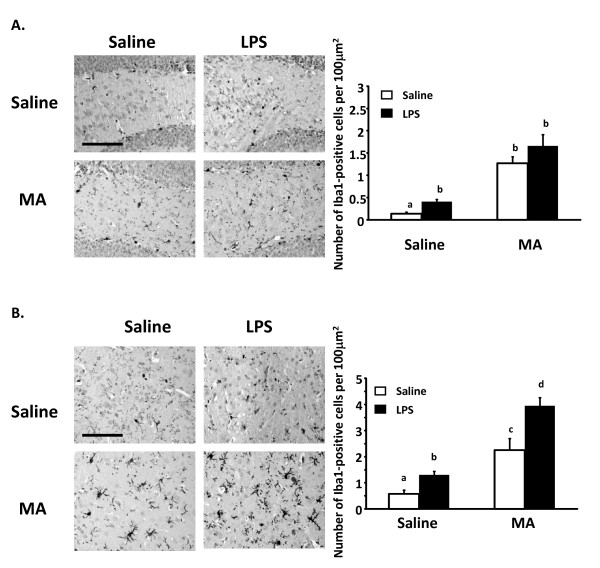
Figure 4.
Iba1 expression 4 h after LPS in mice exposed to methamphetamine. Immunohistochemical staining of Iba1 in the dentate gyrus of the hippocampus (A) and the striatum (B) of mice exposed to MA prior to LPS administration at 40× magnification. Mice were exposed to four i.p. injections of 0 or 5 mg/kg MA at 2 h intervals and then injected with 100 μg/kg LPS or saline 24 h after the first MA injection. Brains were collected 4 h after LPS administration. Scale bar = 100 μm. Bar graphs express number of Iba1-positive cells per 100 μm2.

