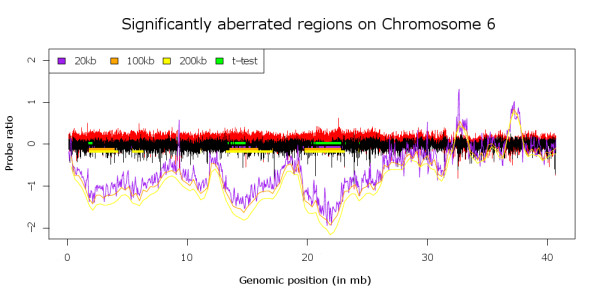
Figure 4.

shows the probe ratios for the T- and B-cell lymphoma data (in red and black respectively). The KC-SMARTR profiles (lines) and significant regions (blocks) using different kernel widths are shown in different colors (see legend for details). In green the regions that are reported as significant by the t-test on segmented data are shown. The larger kernel widths (100 kb and 200 kb) allow the detection of larger regions whereas the smaller kernel width (20 kb) allows the detection of smaller regions. In this way the data can be analyzed on different scales. In contrast, the t-test only reports regions on a single scale.
