
Figure 2.
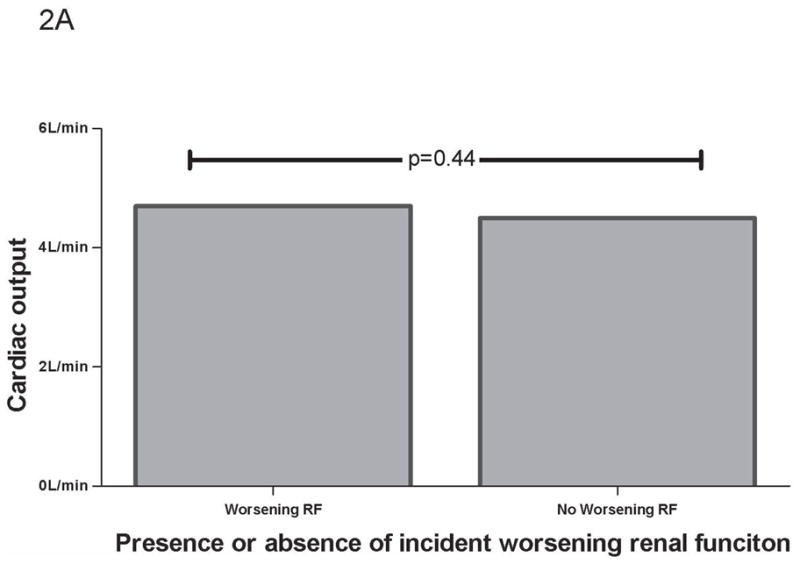
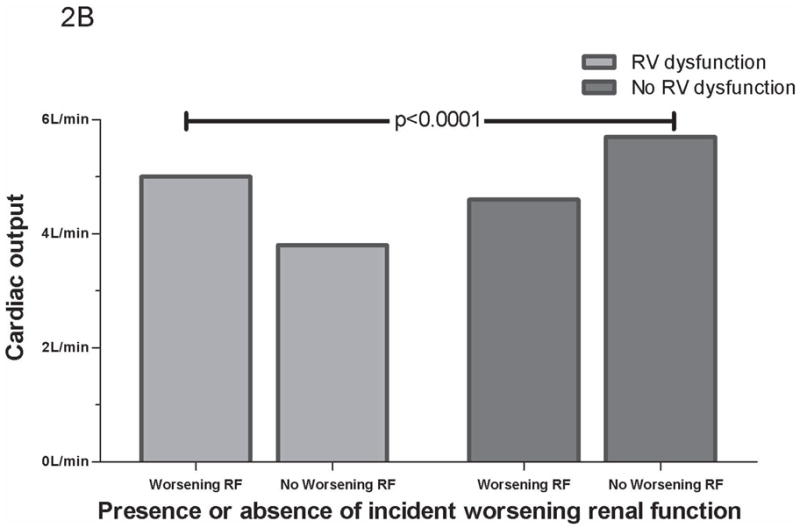
CO grouped by worsening RF. (A) CO grouped by worsening RF in total cohort. (B) CO grouped by worsening RF and RV dysfunction. No RV dysfunction defined as absence of any RV dysfunction measure correlating with CO (tricuspid annular plane systolic excursion, fractional area change, or qualitative RV dysfunction). p values represent between group differences. CO =cardiac output. RF=renal function. RV= Right ventricle.