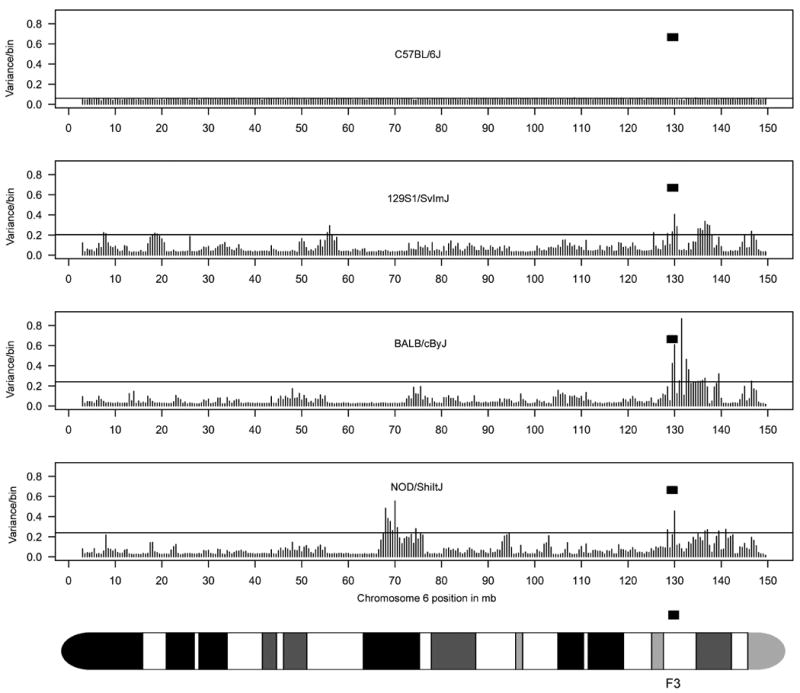
Figure 1. Index of variability along chromosome 6.

For the inbred mouse strains indicated, the variance of the log2 ratios of the signal intensities (see Supplemental Figure S1) for probes within each bin (500,000 bp/bin) was captured (see Methods for calculation). At 500,000 bp/bin, there is a total of 294 bins for chromosome 6. Each bar represents a bin along the chromosome. The bin size had minimal effect in capturing variability (Supplemental Figure S2). The horizontal line in each graph is at 2 standard deviations (sd). The NKC genomic region is highlighted by the filled rectangle. The NKC is positioned within the F3 band as indicated by the ideogram of chromosome 6.
