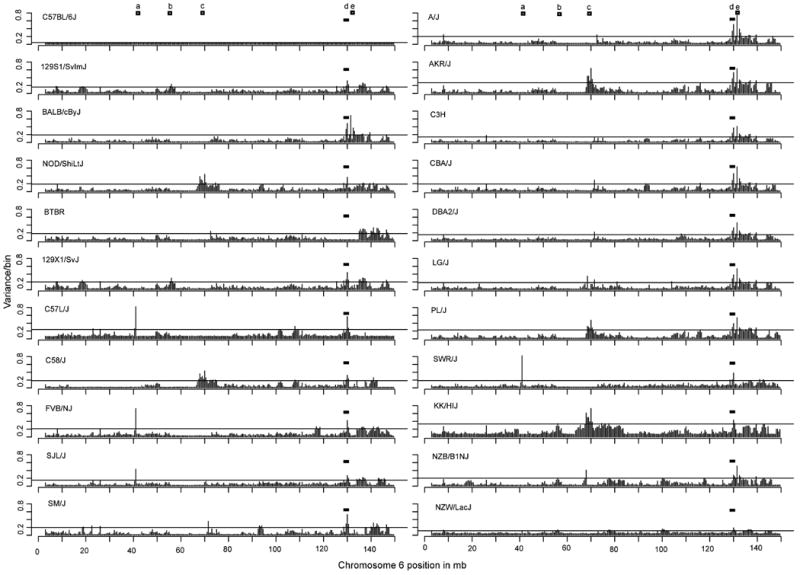
Figure 2. A comparison of the variability along chromosome 6 for 22 inbred mouse strains.

Shown is the variance within each 500,000 bp/bin. The regions of significant variability (greater than 2 sd) along the chromosome (other than the NKC) are represented by an open square. The NKC region (d) at ∼120.5 to 130 Mb is highlighted by the filled rectangle. Region a is at ∼41-41.5 Mb, region b is at ∼56-56.5 Mb, region c is at ∼70-70.5 Mb, and region e is at ∼131.5-132 Mb positions.
