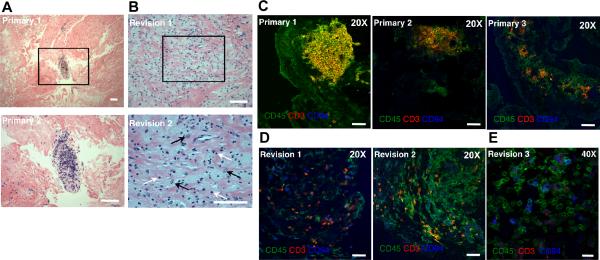
FIGURE 1.
Histological features of primary OA synovium and revision interfacial tissues. Paraffin sections of synovial tissues from primary (A) or revision (B) TJR were stained with H&E to evaluate the synovial tissue architecture. (A) Lymphocytes in primary synovial tissues congregated in clusters among masses of largely acellular fibrous tissue. An enlargement of the boxed region is shown in the lower panel (white bar =100μm). (B) In contrast, lymphocytes in revision interfacial samples were scattered throughout the tissue (2 different patients shown). An enlargement of the boxed region from revision sample 2 is displayed in the bottom panel (white bar =100μm). White arrows indicate some of the infiltrating lymphocytes; black arrows indicate some of the macrophages. Cryostat sections (8 mm) of joint tissues from primary (C) or revision (D, E) patients were stained for CD45 (FITC), CD3 (PE), and CD94 (APC). (C) CD3+ lymphocytes were organized in lymphocyte clusters in primary synovial samples (3 different patients). (D) CD3+ T cells and CD3−CD94+ NK cells were scattered throughout revision interfacial tissues (2 different patients); white bar = 10μm. An enlargement of a stained revision section is shown in (E) (white bar = 20μm).

