
Figure 1.
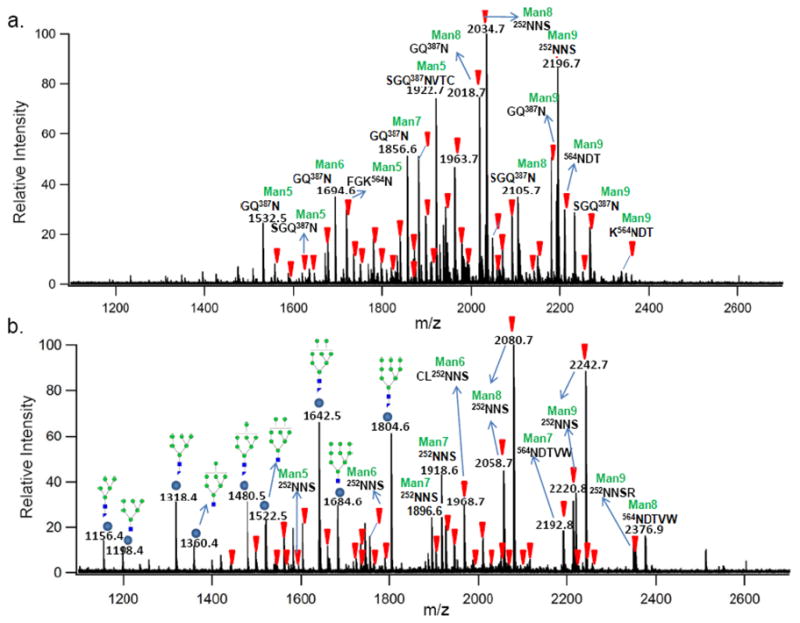
(a) Negative ion mode MALDI FT ICR MS spectrum of b-LF glycopeptides after 24 hrs immobilized pronase digestion. (b) Positive ion mode MS spectrum of the same b-LF glycopeptide sample. Inverted triangles ( ) represent potential glycopeptide peaks labeled based on the GP finder analysis of the spectrum mass list, and circles (
 ) indicate dissociated glycan peaks.