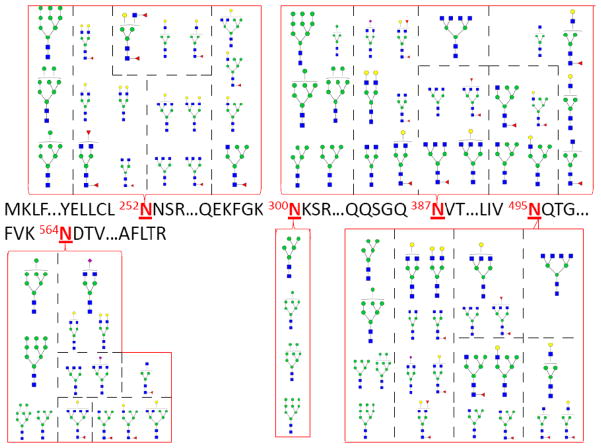
Figure 6.
Glycosylation associated with each glycosite of bovine lactoferrin (b-LF). The various glycans at each site indicate glycan micro-heterogeneity in the occupancy of the five glycosites observed during the negative ion mode MS analysis of the b-LF glycopeptides. For each glycosite, the larger glycan structures represent corresponding glycopeptides with minimum relative intensities of 20% while the smaller glycan structures represent corresponding glycopeptides with relative intensities corresponding to less than 20%. Circles ( and
and  ), squares (
 ) and triangles (
 ) represent hexose, GlcNAc and fucose residues, respectively.

