
Figure 7.
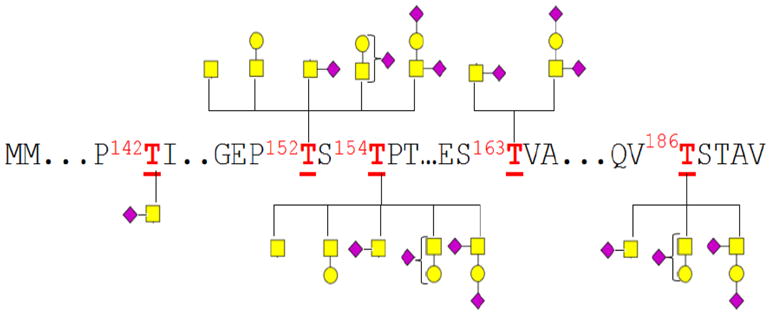
Glycosylation associated with each glycosite of kappa casein (k-CN). The various glycans at each site indicate glycan micro-heterogeneity in the occupancy of the five glycosites observed during the negative ion mode MS analysis of the k-CN glycopeptides. Rectangles ( ), circles (
 ) and diamond symbols (
 ) represent GalNAc, Gal and NeuAc residues, respectively.