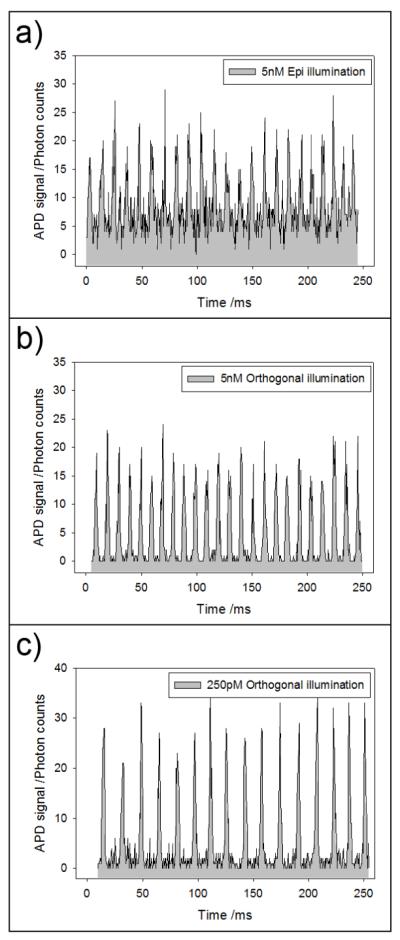
Figure 4.

Detection of droplet streams. (a) Time trace showing the detection of individual passing droplets (each photon spike corresponds to one droplet) using the epi-confocal geometry. Each droplet contains 5 nM of fluorescein. (b) Detection of the same droplet stream as in (a), but with orthogonal-line-confocal excitation. (c) Even at 250 pM concentrations of fluorescein, which corresponded to ~2200 molecules of fluorescein in the 30 μm diameter droplet, the signal-to-noise ratio was excellent. The laser power used in (a) and (b) was 0.75 mW, and in (c) was 7 mW.
