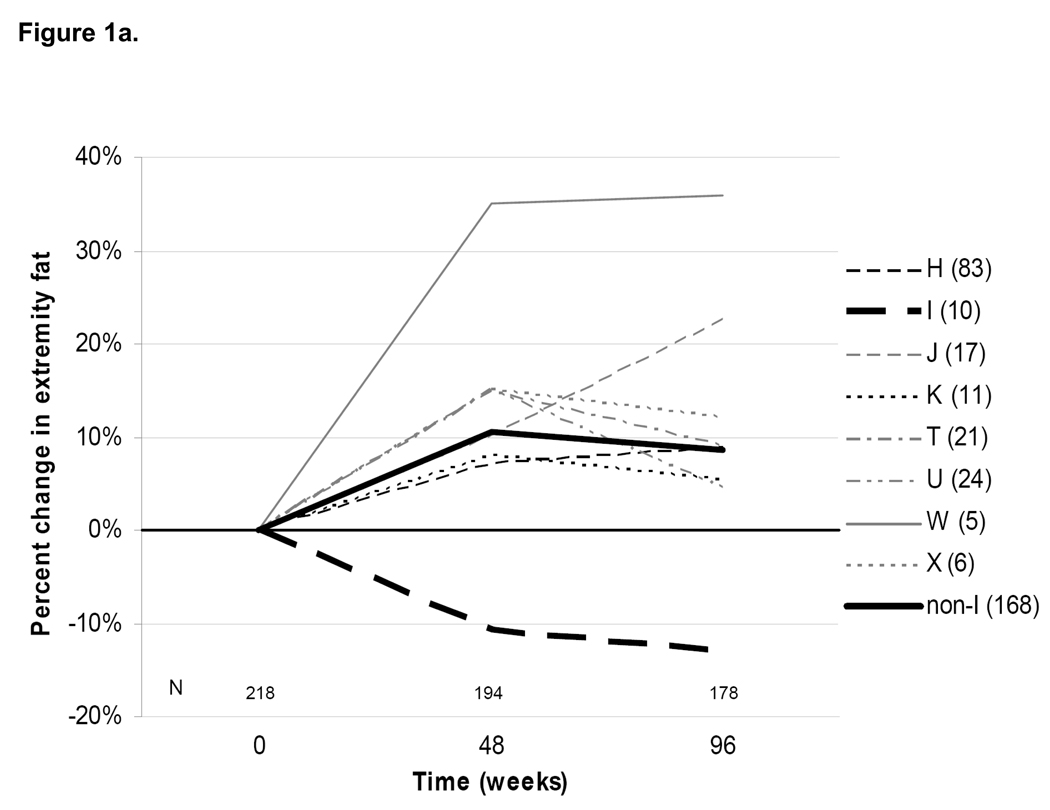
Figure 1. Median percent changes in (a) extremity fat by DEXA and (b) fasting non-HDL cholesterol from baseline to 48 and 96 weeks after randomization, by mtDNA haplogroup.
Dark horizontal line indicates no change. Individual lines represent different haplogroups. Thick lines denote changes within haplogroup I (dashed lines) and combined non-I haplogroups (solid lines). For Figure 1a: P=0.08 for 96-week difference in median percent changes in extremity fat between I and non-I groups; P=0.02 for haplogroup W versus combined non-W haplogroups. Baseline and 96-week DEXA data are also shown in Table 3. For Figure 1b: P<0.001 for 96-week difference in median percent changes in non-HDL cholesterol between I and non-I groups. Sample sizes with available data at each time point are shown above the horizontal axis; individual haplogroup sample sizes with data available at 96 weeks are shown in the haplogroup legend. Note: the total non-I haplogroup sample sizes shown include a single subject belonging to haplogroup V.


