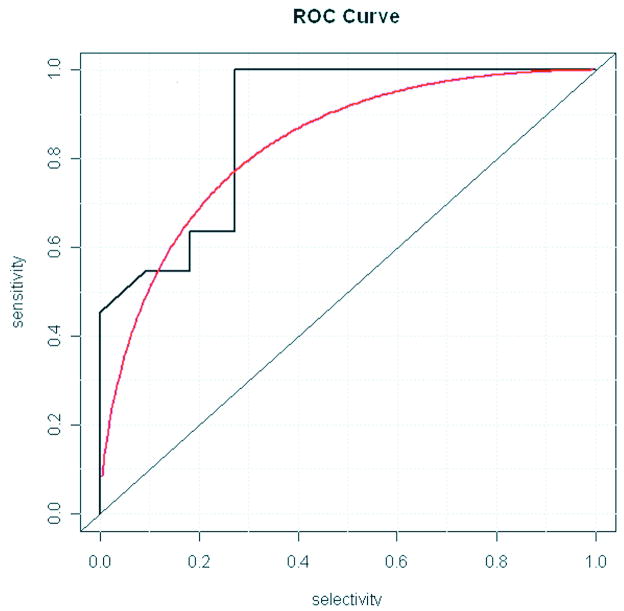
Figure 2. ROC curve for Similarity- PPI Filter.
ROC curves for the Similarity-PPI curve were generated with the R project software package. The empirical curve (black) and binormal curve (red) are shown. The binormal curve is calculated based on the assumption that the data is from a normal distribution. The area under the empirical curve is 0.9 (p = 0.001).

