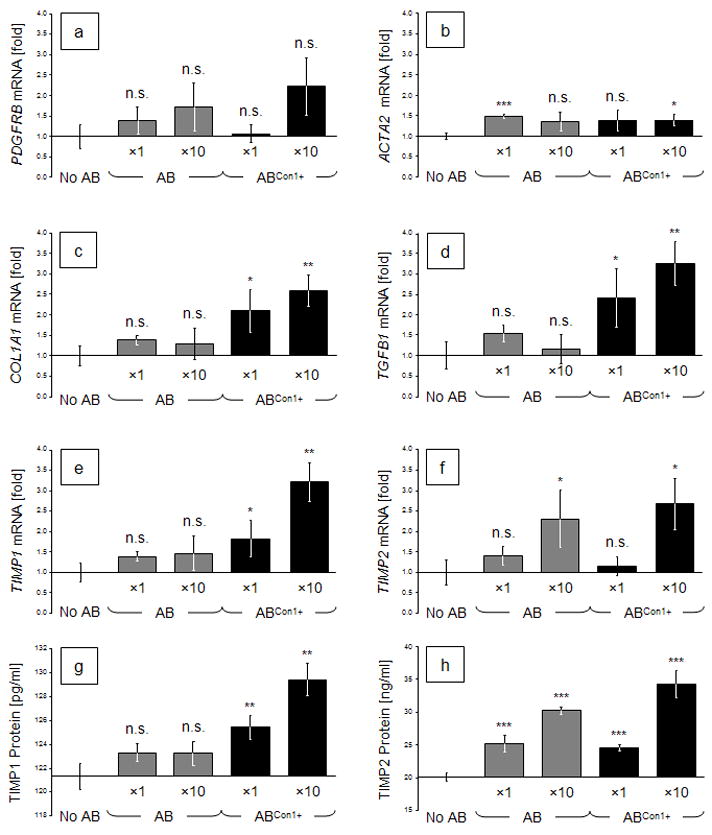
Fig. 4.

Relative expression rates of activation- and fibrosis-related genes in LX-2 cells after incubation with different concentrations of Con1− or Con1+ ABs. On day 1, cells were incubated with ×1 or ×10 concentrations of such ABs (normalized against apoptotically cleaved cytokeratin-18 neoepitope M30). (a) to (f): mRNA expression rates of treated cells were determined on day 2 and normalized against SDHA expression, relative to non-AB-treated controls. (g) and (h): TIMP1 and TIMP2 protein concentrations in LX-2 supernatants. Bars depict means (a–f: n = 3; g, h: n = 6) ± standard deviations. Two-tailed t-tests of treated vs. untreated conditions: *: p < 0.05; **: p < 0.01; or ***: p < 0.001.
