
Figure 3.
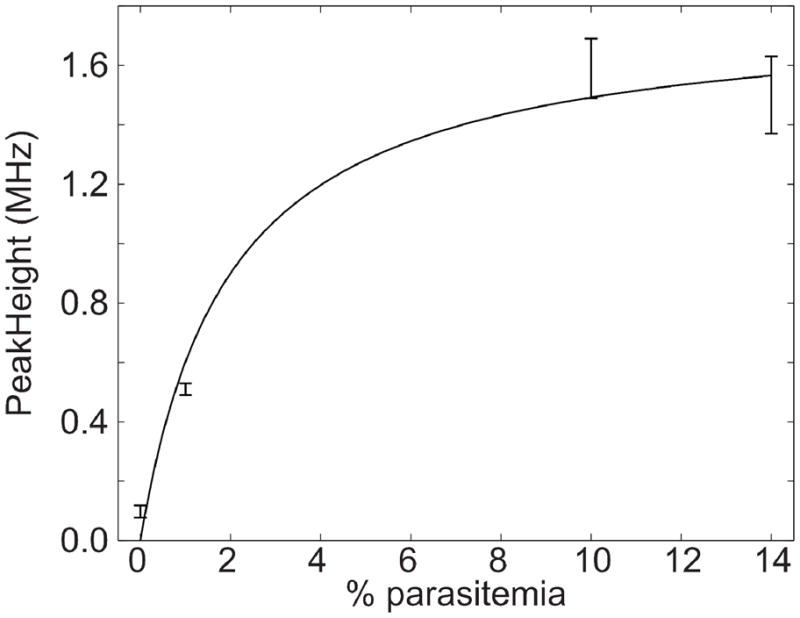
Plot of peak height versus % parasitemia. Peak height was obtained by using a nonlinear least squares routine to fit a Gaussian function to the data of Figure 2. Error bars are ± one standard deviation from three electrophoretic replicates. The smooth curve is a weighted nonlinear least-squares fit of a saturation function to the data.