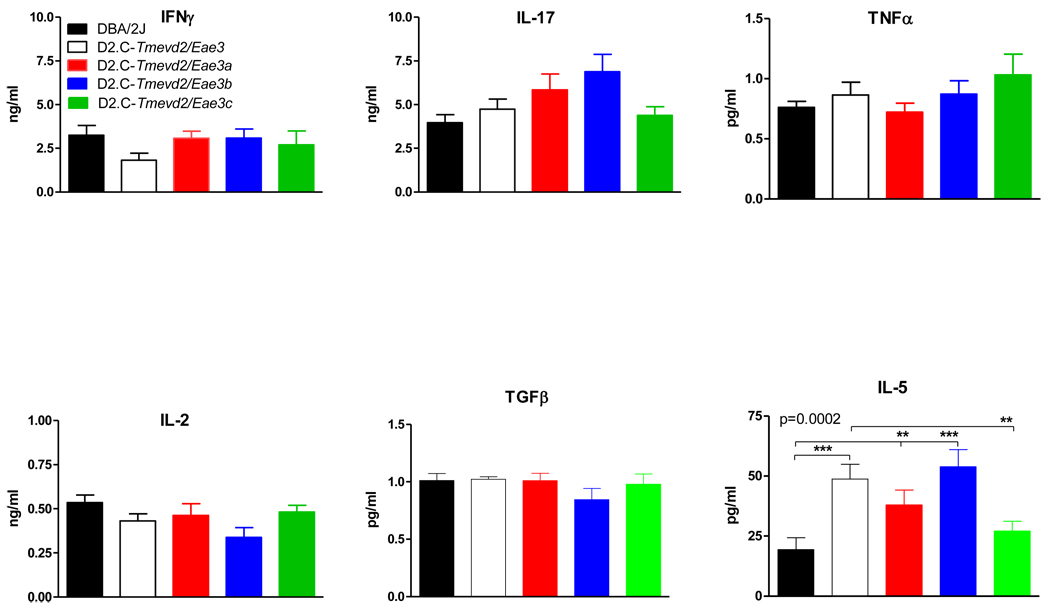
Figure 3. Ex vivo PLP-specific responses of PLP180–199-CFA plus PTX immunized DBA/2J, D2.C Tmevd2/Eae3 and ISRC lines.
Cytokine, chemokine, and growth factor production were assessed by stimulating splenocytes and lymphocytes from draining lymph nodes on day 10 after immunization with PLP180–199-CFA + PTX. Single cell suspensions were stimulated with 50 µg PLP180–199 for 72 hr and the levels in supernatants were quantified using the Millipore MILLIPLEX™ MAP assay kit or ELISA (n = 10/group). The significance of differences among the strains was determined using a Friedman's test, an ANOVA based on ranked data. Significant differences in the main effect of strain were followed by a priori planned contrasts based on a multilevel congenic mapping strategy (DBA/2J vs. D2.C-Tmevd2/Eae3 followed by D2.C-Tmevd2/Eae3 vs. individual ISRC lines, and confirmed by comparison of individual ISRC lines with DBA/2J). Of the 25 cytokines assayed IL-5 singularly exhibited significant differences in the main effect of strain (p = 0.0002) that was significantly different between DBA/2J and D2.C-Tmevd2/Eae3 mice and segregated among the ISRC lines (**, p < 0.01; ***, p < 0.001).

