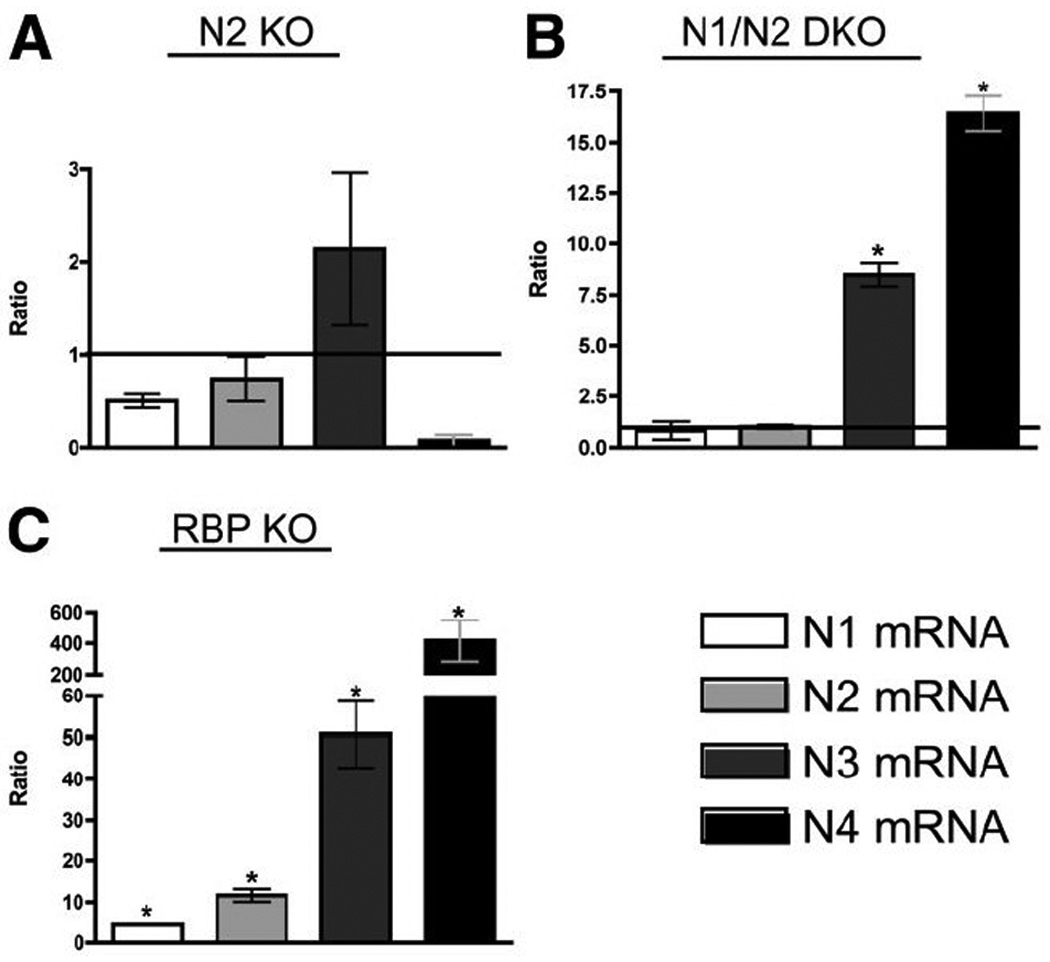
Fig. 2. Notch receptor mRNA expression increases as Notch signaling dosage decreases at P15.

The relative expression ratio of Notch receptors was calculated using real-time PCR efficiency and the deviation in cycle threshold (Ct) of experimental versus control [without Alb-Cre] samples, expressed in comparison to HPRT mRNA levels. (A) In N2 KO, there are no significant changes in receptor mRNA. (B) In N1/N2 DKO there is significantly higher N3 and N4 mRNA being transcribed. (C) In RPB KO, all Notch receptors are significantly up-regulated, suggesting a feed-forward loop attempting to compensate for the loss of Notch signaling. Despite increased receptor expression, without RBP-JK, Notch receptors cannot activate downstream targets. Statistical analysis was performed using a one-way ANOVA with Tukey’s Multiple Comparison Test. Error bars are standard error of the mean. *P<0.05.
