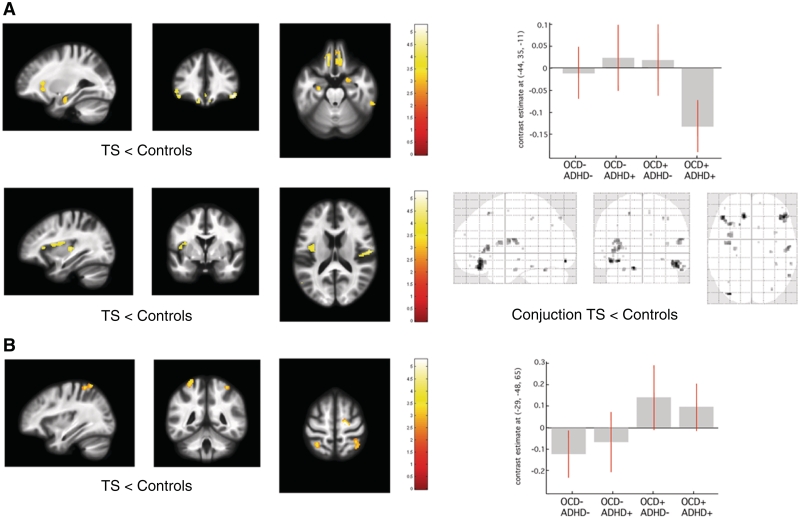
Figure 2.
Statistical parametric maps of significant cortical thickness change in the Tourette syndrome cohort superimposed for presentation purposes at P < 0.001, uncorrected on T1-weighted image. Right panel: box-plots of regression coefficients (betas) extracted from the voxel of maximum intensity over Tourette syndrome (TS) sub-groups depending on the presence (+) or absence (−) of co-morbidity OCD/ADHD (red bars indicating 90% confidence interval); ‘glass brain’ with the result of the conjunction analysis. (A) Cortical thickness decrease in patients with Tourette syndrome compared with controls. (B) Cortical thickness increase in patients with Tourette syndrome compared with controls. [x, y, z] coordinates refer to the Montreal Neurological Institute standardized space. Colour scales on the right indicate t-values.

