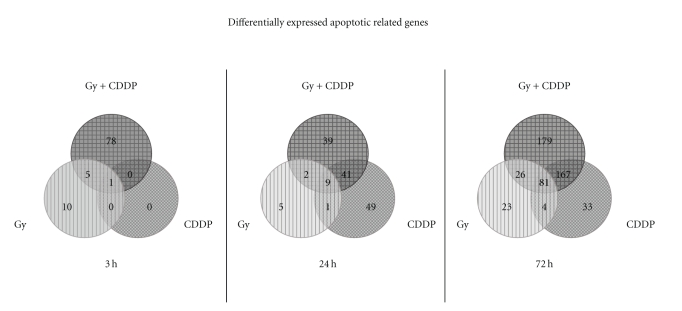
Figure 3.
Microarray findings are summarized by Venn diagrams which show the distribution of differentially expressed probeset IDs in each treatment group [irradiation (Gy), cisplatin (CDDP) or combination of both (Gy and CDDP)] when compared to nontreated control cells at 3 h, 24 h, and 72 h after treatment.

