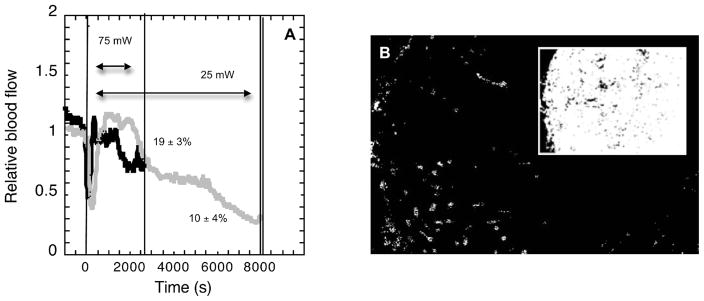
FIG. 4.
Relative tumor blood flow (panel A) during motexafin lutetium (10 mg/kg, 180-min drug–light interval) PDT to 200 J/cm2 at 25 mW/cm2 (gray) and 75 mW/cm2 (black). Plots indicate representative average relative blood flow (error bars not shown for clarity) normalized to blood flow in the minute prior to beginning illumination. Single vertical lines indicate the start of illumination and the end of illumination at 75 mW/cm2. Double vertical line indicates the end of illumination at 25 mW/cm2. The percentage of blood vessels perfused at treatment completion, as measured by histological analysis, is indicated next to each blood flow plot; these values represent the average ± SE from five animals per group and are significantly different by Wilcoxon Rank Sums analysis. Representative histological image (panel B) exemplifies the pattern of incomplete vascular shutdown at PDT conclusion, with greater perfusion visible at the tumor periphery; inset depicts tumor area within the section and shows the location of the tumor periphery along the left side of the image. No perfused blood vessels are present in the area obstructed by the inset.

