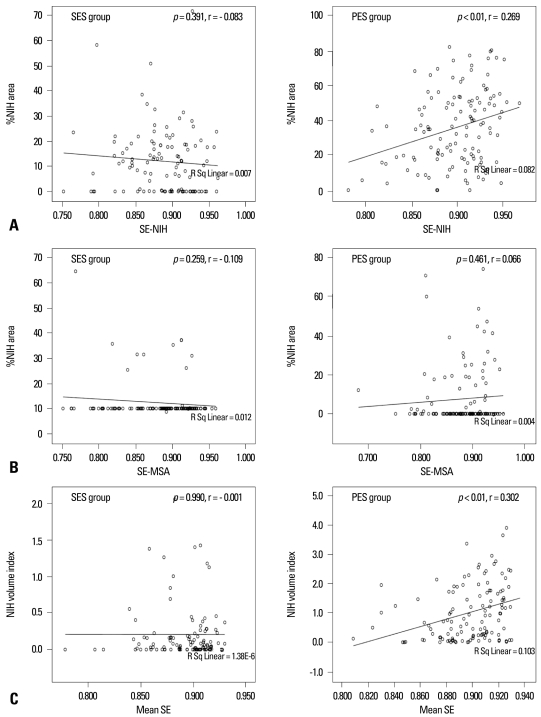
Fig. 2.
Association between three different SEs and neointimal hyperplasia. (A) Correlation between SE-NIH (determined at the narrowest portion with large NIH on follow-up IVUS) and %NIH area. (B) Correlation between SE-MSA (determined at the site with minimal stent CSA) and %NIH area. (C) Correlation between mean SE (averaged value through the entire stent) and NIH volume index. SE, stent eccentricity; NIH, neointimal hyperplasia; IVUS, intravascular ultrasound; MSA, minimal stent area; CSA, cross-sectional area.

