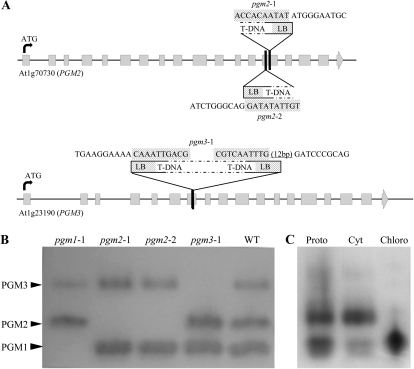
Figure 3.
Gene structure and assignment of PGM activities to PGM2 and PGM3. A, Gene structure of the cytosolic PGMs showing similar exon/intron structure and the same number of exons. The exons are shown as boxes, and both genes are at the same scale. Triangles illustrate T-DNA insertion sites in exons of PGM2 and PGM3 in the mutant lines. T-DNA-specific sequences at the left border (LB) are given above (hatched boxes). The following sequence is gene specific. In the case of pgm3-1, the T-DNA has two left borders, suggesting a tandem inverted repeat. B, PGM isoform separation by native PAGE, followed by enzyme activity staining. Three distinct activities are visible. In each of the single mutants, one specific enzyme activity is completely missing. The band with the lowest mobility is assigned as PGM3, that with the highest mobility as PGM1, and the activity in between as PGM2. WT, Wild type. C, Protein localization of the PGMs in wild-type leaf extract. All three enzymes are contained in isolated protoplast (Proto). Protoplast fractionation into cytosol-enriched (Cyt) and chloroplast-enriched (Chloro) fractions shows PGM1 to be plastidial, whereas PGM2 and PGM3 are cytosolic.

