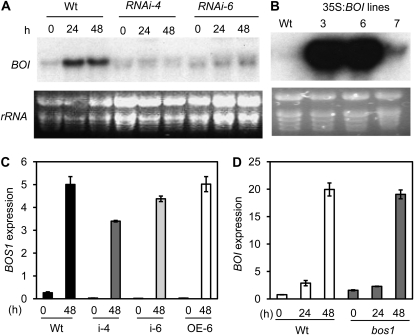
Figure 3.
BOI RNAi and overexpression lines and their effects on BOS1 gene expression. A and B, RNA blots showing BOI RNAi lines with reduced BOI gene expression (A) and 35S:BOI lines with increased BOI expression (B). C and D, qPCR showing expression of BOS1 in BOI RNAi and 35S:BOI lines (C) and BOI in the bos1 mutant (D) in response to B. cinerea. For RNA blots, total RNA (15 μg) was loaded per lane. qPCR was performed as described in “Materials and Methods.” The qPCR data represent expression levels calculated by the comparative cycle threshold method (Applied Biosystems), with the Arabidopsis Actin2 gene as the endogenous reference for normalization. Experiments were repeated at least two times with similar results. h, Hours after inoculation; Wt, wild type. rRNA was used as a loading control.

