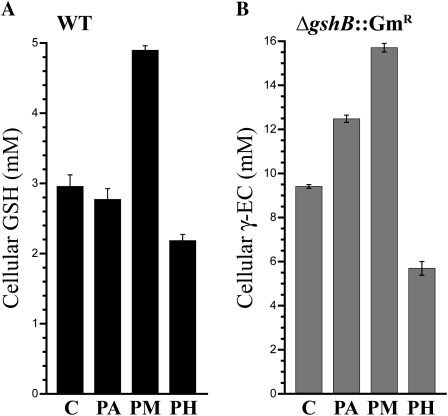
Figure 6.
Cellular thiol content after addition of Glc. The major cellular thiol was measured in the wild type (WT; GSH; black bars; A) and ΔgshB::GmR (γ-EC; gray bars; B) grown photoautotrophically (PA), photomixotrophically (PM) in the presence of 5 mm Glc, or photoheterotrophically (PH) in the presence of 5 mm Glc and 10 μm DCMU for 24 h. Values for preculture cells used as the inoculum for the experiment are also shown (C). Error bars represent se of two separate measurements each from two independent cultures.

